Won't it be hard to debug ClojureScript in my browser?
Summary: Even though ClojureScript adds another layer of abstraction, the tooling makes it easier to debug that plain JavaScript.
In the browser, we're dealing with so many levels of abstraction, won't adding another make things harder to understand what's going on? Won't it be hard to find the source of the bug, because we'll be looking at outputted JavaScript code instead of the code we wrote? Will we have to understand how the compiler works in order to translate back into our code?
If you had asked me these questions a year ago, I would have said "yes". But a lot has happened since then, and debugging ClojureScript is, in many ways, easier than debugging JavaScript. ClojureScript (and, honestly, the browsers, as well) has come a long way.
Intuitively, Clojure and ClojureScript have been better designed than JavaScript. JavaScript was designed and implemented in ten days. We're lucky that it works at all. And now it has to support backwards compatibility. Let's go over some of the specific things that makes debugging easier in ClojureScript.
Unknown variables
Let's start at the beginning. When ClojureScript is compiled to JavaScript, it's a great time to do a little analysis. The entire file is read in, with all of its dependencies, and so there are certain errors you can detect without running the program. One of the easiest things to detect is variables that are accessed but never defined.
In JavaScript, this won't give an error until you run badFunction:
function badFunction() {
  var myVariable = 10;
  return myVarible + 1; // misspelled variable
}
In Chrome, this says:
Uncaught ReferenceError: myVarible is not defined. Notice that
myVarible is misspelled in the code. Of course, this was easy to
detect in this short bit of code. But if we don't run badFunction
right away to force the error, this code could make it to production
and stop working in a customer's browser. This kind of bug is
difficult even to detect.
In ClojureScript, I can write something similar:
(defn bad-function []
  (let [my-variable 10]
    (+ my-varible 1)))
But once I type that in, I get a warning right away. I've detected the
bug immediately:
WARNING: Use of undeclared Var cljs.user/my-varible at line 3.
Function call warnings
ClojureScript can also warn me if I call a function with the wrong number of arguments. In JavaScript, this is legal:
var firstname = "";
var lastname  = "";

function saveName(first, last) {
  firstname = first;
  lastname  = last;
}

// later ...

saveName("Eric"); // what about last?
What error will JavaScript give you in this case? Nothing! It will
set lastname to undefined.
In ClojureScript, if I call a known function of two arguments with only one argument, it will at least tell me.
(defn two-args [a b]
  ;;...
  )

;; later ...

(two-args 1)
ClojureScript will tell me:
WARNING: Wrong number of args (1) passed to cljs.user/two-args at line 132.
Type inference
ClojureScript does a little bit of type inference. It's not Haskell, but it can catch some major errors.
Ugh, JavaScript can have some really cryptic behavior. Again, you won't see this until runtime.
> 5 + [1];
"51"
>
ClojureScript will give a warning when it can infer numeric math errors:
> (+ 5 [1])
WARNING: cljs.core/+, all arguments must be numbers,
  got [number cljs.core/IVector] instead. at line 1
"5[1]"
It still gives a weird answer, but the warning is given at compile time.
Source Maps
So those are some of the bugs that ClojureScript can detect at compile time. But other bugs still happen and you'll want to figure out where in the code they are. Luckily, ClojureScript has great Source Maps support.
Source Maps are a feature of your browser's developer tools that tell it where in your code the bug happened.
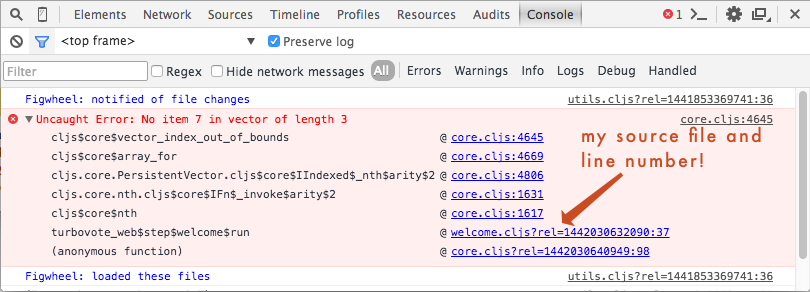
If something throws an error, I can see in my console the error, the
source file, and the line number. Notice that it's a cljs source file!
The whole stack trace is like that.
Stacktrace with CLJS source
When I click on one of the files, I'm whisked to my actual code as I wrote it. I can see exactly what line the problem happened on.
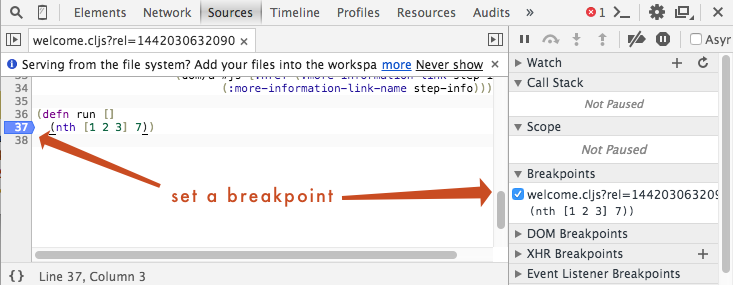
Set breakpoints in CLJS
I can even set breakpoints!
REPL
You can run ClojureScript code right in the browser with the built-in ClojureScript Browser REPL. The JavaScript console lets you run JavaScript to test things out and figure out what your state is. The ClojureScript REPL give you the same power to interactively try out functions, inspect state, and access the DOM.
Incremental compilation
Because your code is being compiled as you write it, you will see the errors and warnings much, much sooner than you would if you had to reload your browser and trigger your code to run.
Fewer bugs in general
Finally, ClojureScript avoids lots of bugs by virtue of its more functional semantics. ClojureScript is immutable by default. It is not weakly typed. And the language is more thought out. You'll simply encounter fewer bugs in ClojureScript. And the bugs you do have are the same bugs that you would have had in plain JavaScript.
Conclusions
ClojureScript has come a long way for debugging. It has embraced its nature as a compiled language and built in simple static analysis that catches many errors. And the excellent support for REPL-driven development and incremental compilations make it great for debugging small bits of code before they get lumped into the whole program. And finally, ClojureScript's semantics are less prone to bugs that JavaScript's. I actually feel that JavaScript is harder to debug.
If you're interested in getting started with ClojureScript, I recommend LispCast Single Page Applications with ClojureScript and Om. It uses Om (a React wrapper) to build an application from the ground up. The course teaches everything you need using animations, exercises, code screencasts, and more. It's the fastest and most effective way to learn to build Om applications. The course shows you how to use the REPL and fast, incremental compilation to build your app.